
e-Commerce Analytics & Data Warehousing
Modern e-commerce runs on data, but when your sales, inventory, finance, and marketing tools don’t talk to each other, it’s impossible to get a full picture of what’s working and what’s not.
Mahusai Global Partners helps e-commerce retailers unify fragmented data from systems like your e-Commerce platform, affiliate marketing accounting systems, warehouse & procurement management systems, shipping, Google Analytics, and your multiple ad platforms into a single, centralized analytics platform. We give you the dashboards and insights you need to grow revenue, optimize operations, and make smarter, faster decisions.
We serve both ESTABLISHED COMPANIES and startups


Unlock Actionable Insights Across your E-Business.

Sales Performance Dashboard
Track revenue, orders, AOV, and sales trends across time, products, and geographies.

Product Performance
Segment customers by value, behavior, and channel. Understand retention, LTV, and churn.

Customer Analytics
We help energy companies modernize legacy systems, optimize operations with AI, and build tools for smarter decision-making, across exploration, grid management, and sustainability initiatives.

Profitability & Financial Performance
View COGS, net profit, expense ratios, and margin trends by product category.

Inventory & Supply chain
Monitor stock levels, restock timing, supplier performance, and fulfillment speed.

Affiliate & Marketing ROI
Track campaign performance and affiliate-driven revenue. Measure CAC, CPO, and ad ROI.

Sales by Channel & Region
Compare direct vs. distributor sales. Segment performance by country, partner, and promotion.

Customer Support & Returns
Track ticket resolution, complaint types, and return reasons, improving service and product design.
Our POV: AI is a Scalpel, Not a Sledgehammer
That’s why our approach starts with your strategy, your people, and your customer experience, then applies AI selectively and responsibly.
We’ve seen AI help clients:
Discover untapped customer segments
Brainstorm campaign ideas and visualize whitespace
Streamline asset trafficking and tag management
Rapidly analyze performance data across channels
But we’ve also seen:
Off-brand content that alienates global audiences
Sales decks that erode trust with inaccurate AI summaries
GPT-wrapped tools with zero contextual relevance
Proven Across Industries and Stages
Successfully launched B2B SaaS platforms and consumer mobile apps
Built AI-powered products fueled by rich datasets
Partnered with venture arms of Fortune 500 companies and top-tier VC firms
Staffed by experienced startup founders and product leaders who’ve done this before
Know Your True Profitability
Beyond Gross Margin: Introducing Net Contribution Margin
Most dashboards stop at Gross Contribution Margin, product value minus cost. We go further. MGP’s solution uniquely calculates Net Contribution Margin by factoring in the real-world costs that impact profitability at the order level:
Shipping income and expenses
Refund adjustments
Settlement fees and platform commissions
Import duties and taxes
Order-level advertising costs
We allocate these down to the order and line item, so you know not just what sold, but what made money
This gives e-commerce leaders a truer picture of:
Which products and channels are profitable
Where margin is leaking
How operational changes impact financial performance

Built for Retailers Who’ve Outgrown Spreadsheets
If your team is pulling reports from a half-dozen systems, manually merging data in Excel, or relying on stale, incomplete insights, this is your wake-up call. We deliver:
- A modern cloud-based data warehouse tailored for e-commerce
- Visual dashboards and reports executives actually use
- Seamless integration of your current systems, no rip and replace
- A full view of your operations from click to customer support
MGP Pulse: Ideas with Impact


Selected work
Highlights from recent client projects.

Revamping Digital Platforms for Gaming Success
Discover how MGP transformed a gaming platform with a user-focused redesign, enhanced security, and advanced subscription management for better engagement.
Show more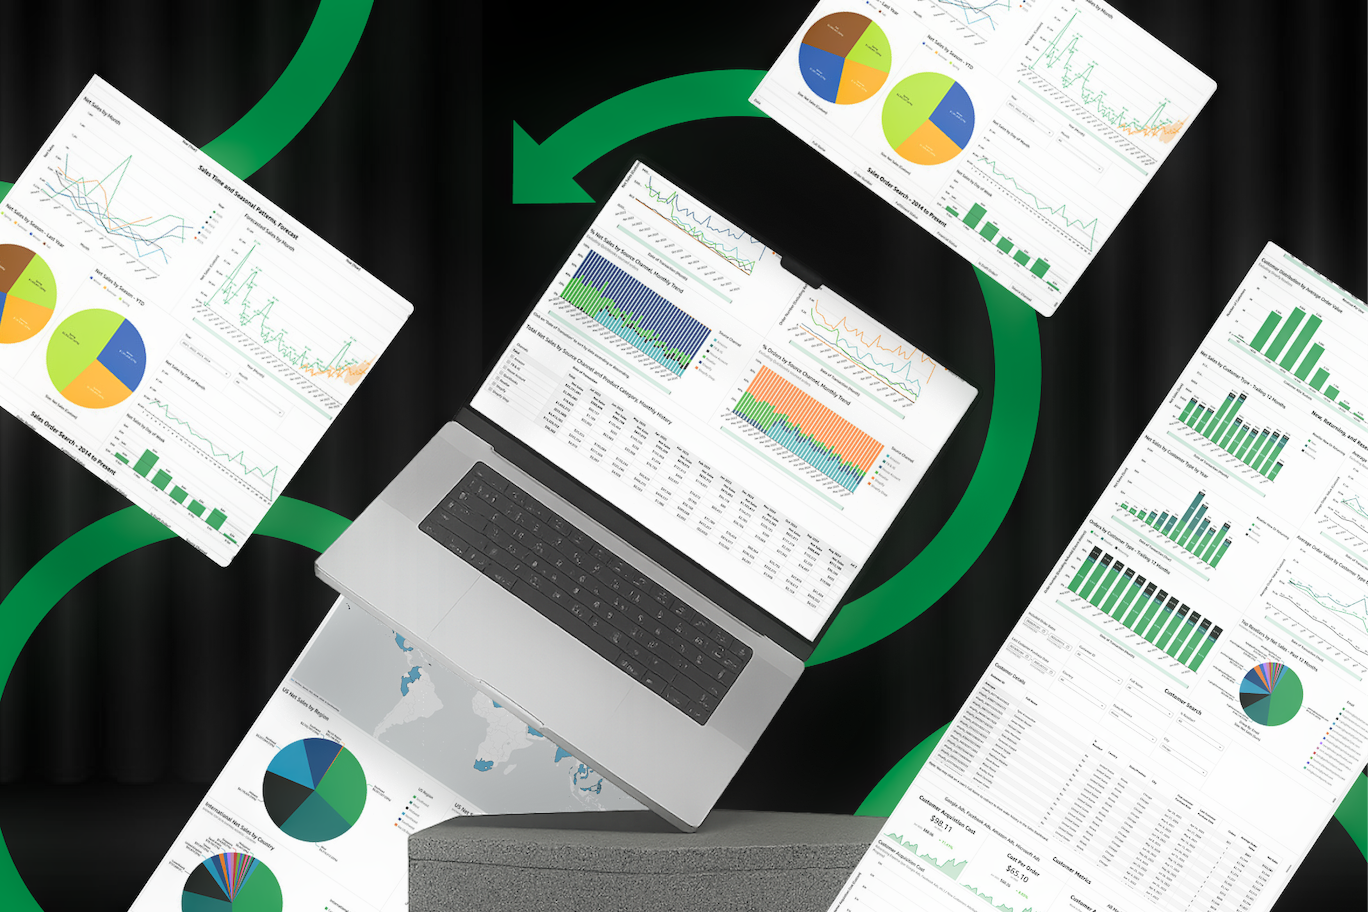
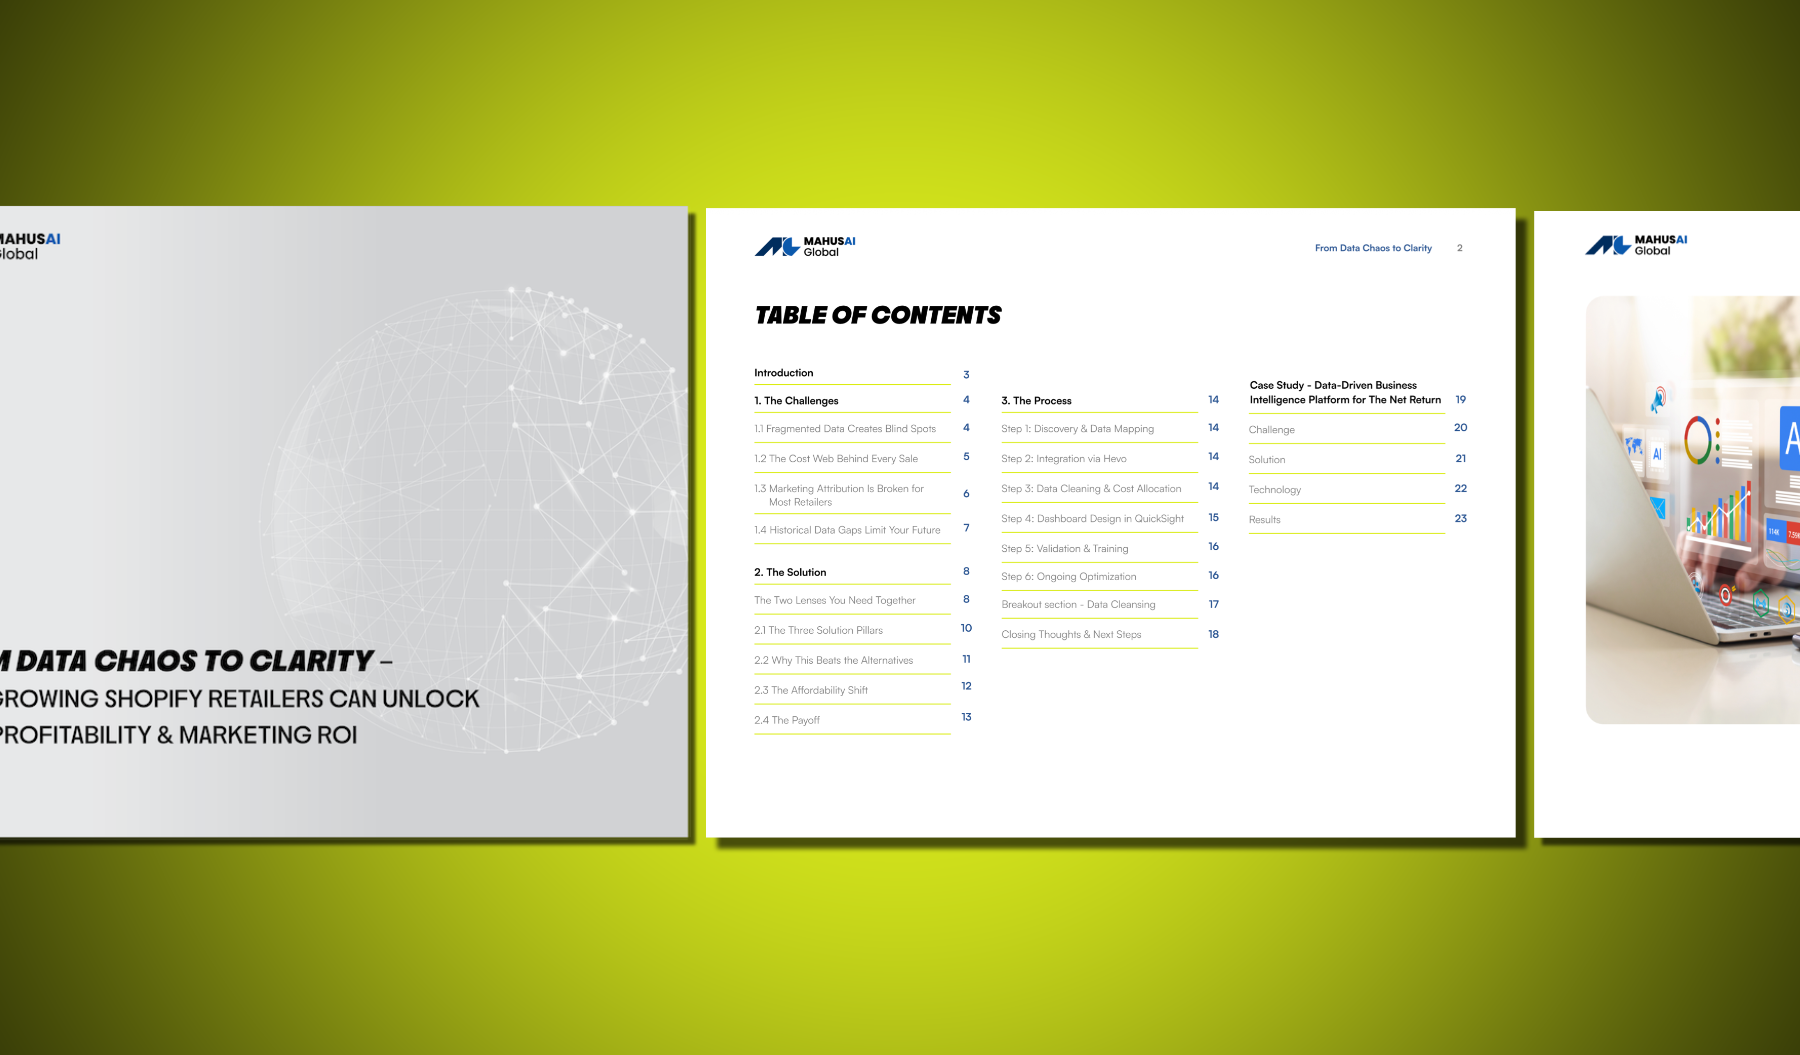
Data-Driven Business Intelligence Platform for The Net Return
Mahusai Global Partners transformed The Net Return’s fragmented e-commerce data into a single source of truth, delivering real-time profitability insights and empowering faster, smarter decisions that drive growth.
Show moreBEYOND TECHNOLOGY: SERVICE Capabilities
Strategy &
Advisory
We help clients align technology with business outcomes, uncovering opportunities for innovation, efficiency, and growth.
UX & UI
Design
Our team crafts intuitive user experiences and high-impact visual assets that drive engagement and adoption.
Product Management
We provide experienced product leadership to define vision, prioritize features, and ensure execution stays aligned with business goals.
Managed
Support
Beyond launch, we partner with clients to operate, optimize, and evolve the solutions we build, ensuring long-term success.
You Know Where You Want to Go. We’ll Help You Get There.
We design, build, and support custom software and data solutions with startup speed and enterprise-grade reliability.

“Bringing on Mahusai Global Partners to help us bring 1089's vision to life has been one of the best decisions we have made. I’ve personally worked with them on multiple different projects and could not be happier with the products they deliver, and by people I have grown to know personally. Beyond bringing expert developers and builders to our team, the communication is consistently clear, easy, and forthright, making global collaboration a breeze.”


"Crosslake has partnered with Mahusai on several technically demanding projects. The engineers they provide consistently demonstrate exceptional technical proficiency and integrate seamlessly into our software teams. Their deep understanding of our clients’ products and ability to adapt to our methods have made Mahusai a trusted, valued partner."


"What impressed me most about Mahusai Global Partners was how quickly they grasped the unique challenges of workforce development in construction for NCCER. They engineered a platform that makes career exploration and job connection seamless for the next generation of skilled workers"